The Build
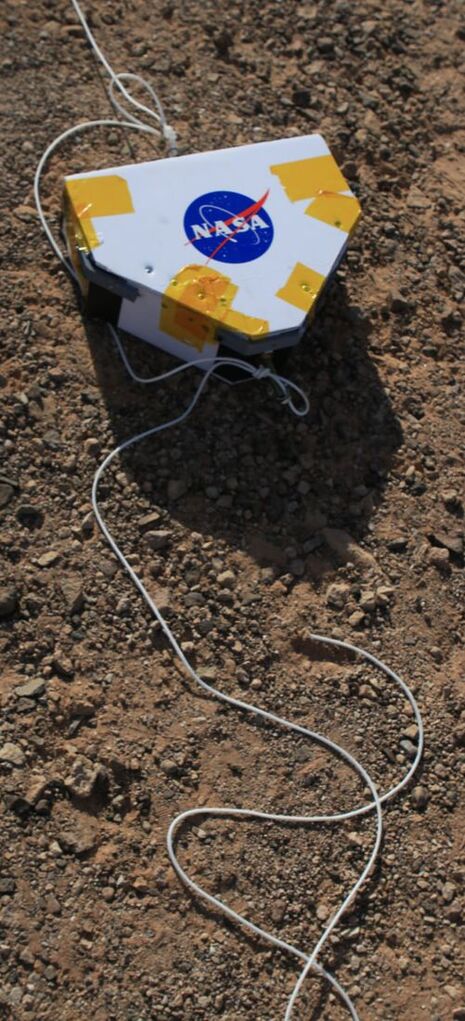
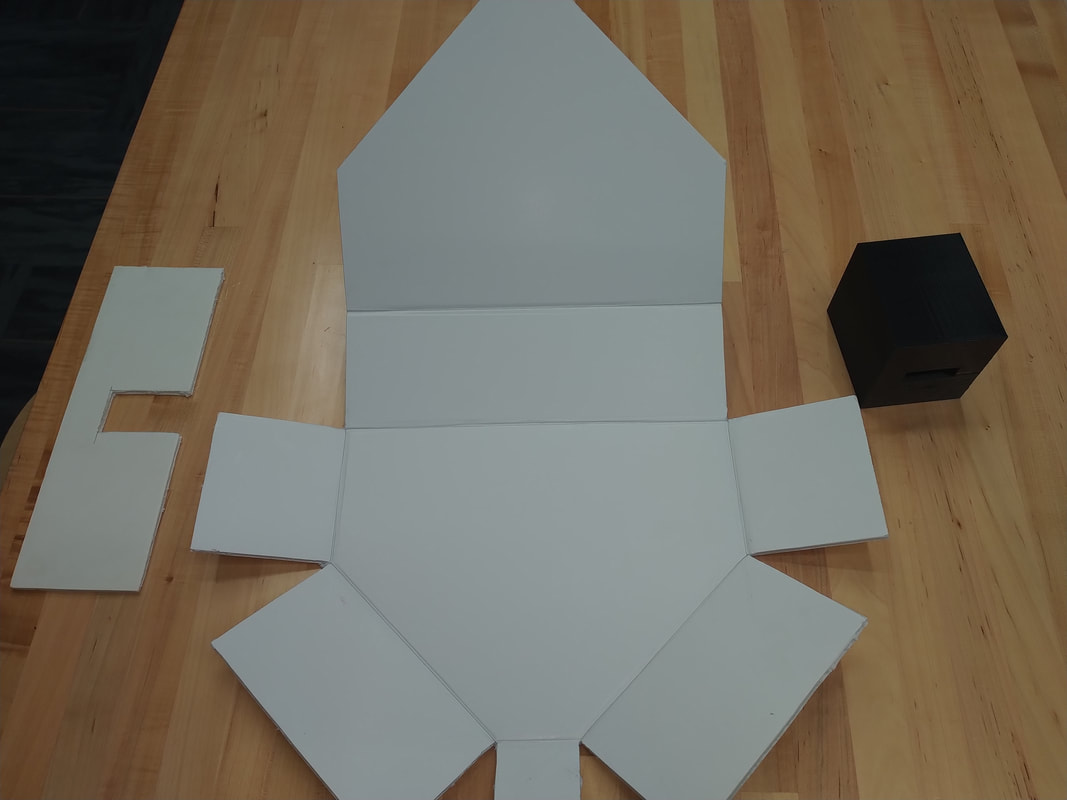
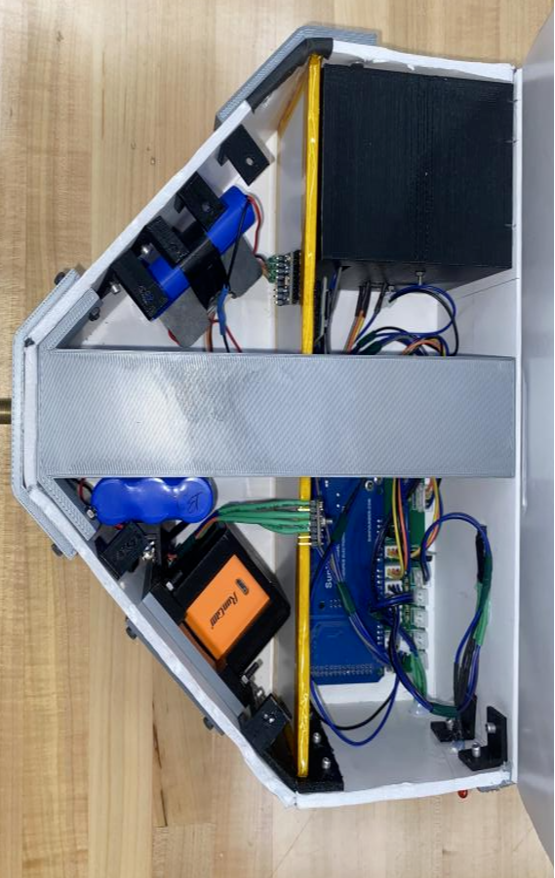
This is the design StratoDevils went with...
|
|
We're the team
Our team rose to the occasion on November 20th, 2021 to launch a new design after the world had to pick itself backup post-COVID.
Dr. Thomas Sharp
Faculty Advisor
Faculty Advisor
Genevieve Cooper
Fall 2021 - Spring 2022
Team Lead, Battery Voltage Specialist, Programmer
Fall 2021 - Spring 2022
Team Lead, Battery Voltage Specialist, Programmer
|
Ben Weber
Fall 2021 - Spring 2022 Temperature Specialist, Payload Designer David Lopez
Fall 2021 - Spring 2022 VOC, Humidity and Atmosphere Specialist, Programmer Jacob Dike
Fall 2021 Pressure Specialist, Payload Designer |
David Rodriguez
Fall 2021 - Spring 2022 Accelerometer Specialist, PCB Designer Anyell Mata
Spring 2022 Payload Designer, PCB Designer Meylin Guas Perez
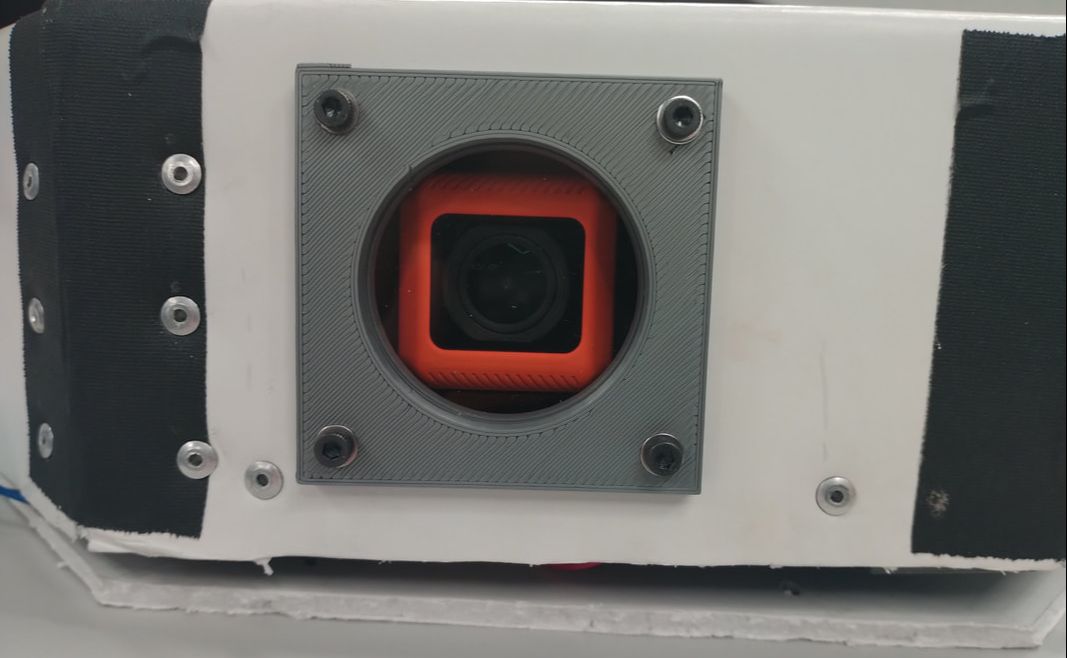
Fall 2021 Camera Specialist |
The DATA
|
|
|
This is footage we caught from the camera on-board. The video on the left is balloon launch while the video on the right is collision. Find all the footage on youtube ASU ASCEND's official account.
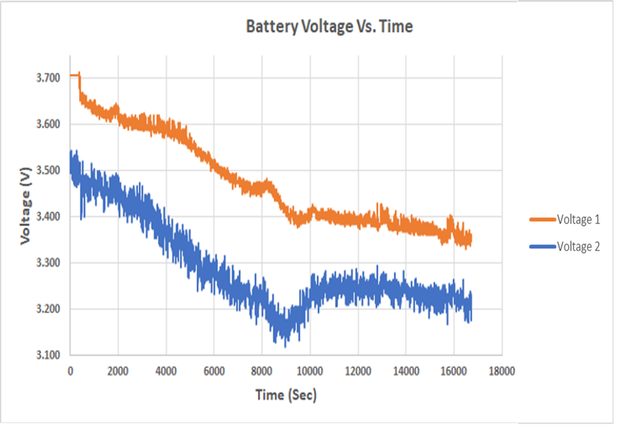
The battery voltage declined at a exponential decay rate. The two voltages are not over lapping as they were in series. and battery 2 was drained first before battery 1. The batteries did drain at a constant rate showing that the payload was powered throughout the flight and the batteries were secured. The graphs show the battery voltages as moving averages to reduce interference we received. We had interference because our PCB did not have a ground plane as well as having our batteries in series.
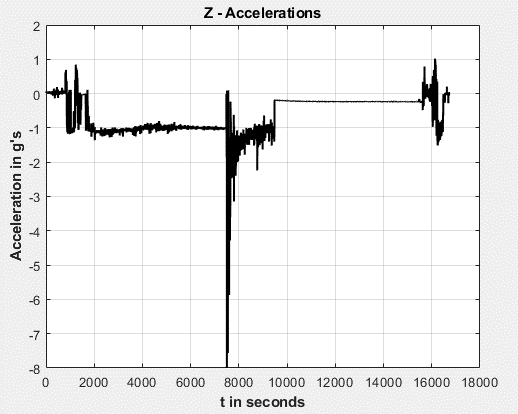
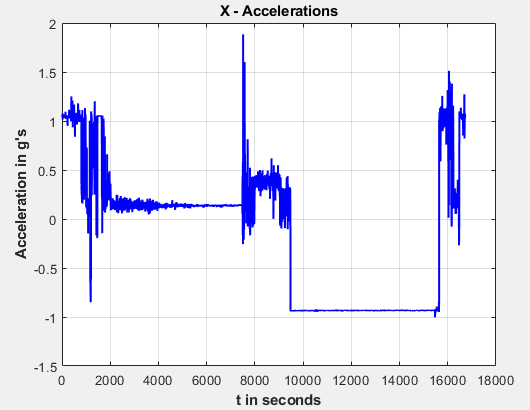

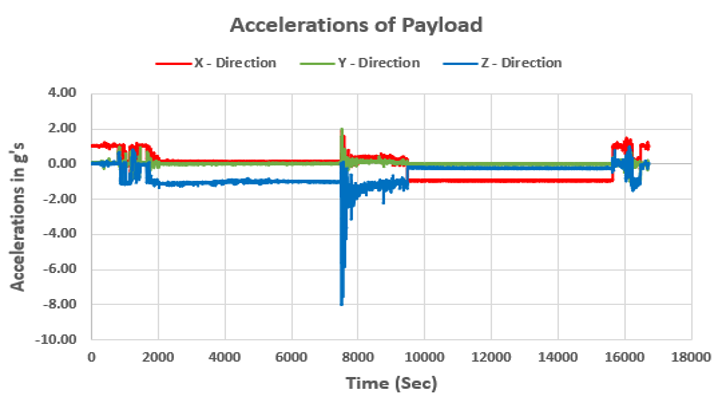
The 3 graphs are accurate to the flight of the payload. The initial spikes in all axes is explained by getting ready for launch. The team powered on the system, carried it over to get tied onto the rope, and eventually lifted by the balloon. The middle spikes are explained by the balloon burst. Once the balloon bursts, the payload experiences the most amount of forces acting on it, because the payload is in free-fall. Then the ending spikes can be explained by once the payload is recovered and picked up by the team.
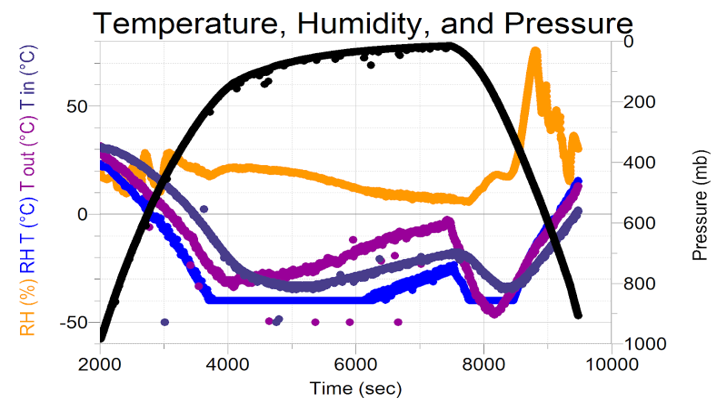
Due to insulation, the temperature inside the payload stays warmer than the outside temperature at first. At the 137.5mb pressure level we begin to see an inversion in the outside temperature; a descriptive property of the Stratosphere, suggesting that at the 137.5mb pressure level our payload had passed the Tropopause. An unintended consequence of insulation caused the internal temperature to become colder than its’ surroundings after passing the Tropopause (during a substantial portion of the flight at the coldest temperatures recorded).
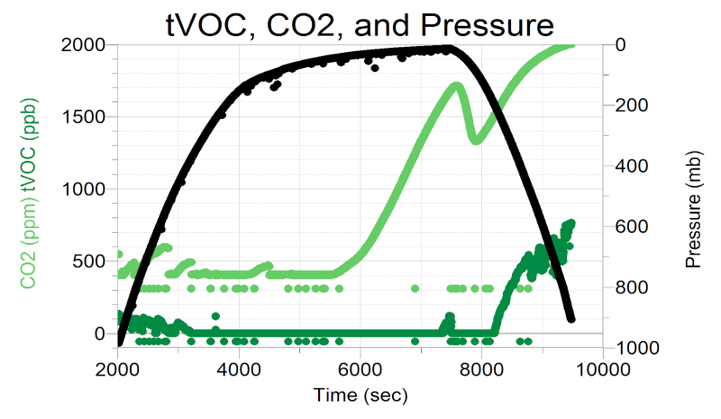
The MiCS-VZ-89TE sensor measured both CO2 in parts per million, and total VOCs in parts per billion. This sensor had an operating limit of 0 degrees Celsius, which was reached at approximately the 420mb pressure level. This explains the loss of measurable data starting at time about t=3200 seconds. What is interesting is the gain of measurable data later in the flight. We know from figure 1 that the inversion began at about time t=4000 seconds, with a temperature of almost 0 degrees celsius at the highest pressure level reached. Knowing that there was a time delay in the Temperature data, the regain of data at about time t=7500 seconds for tVOC can be explained, however the reason for measurable data for CO2 beginning at about time t=5500 seconds cannot be explained, and the CO2 data has since been assumed inaccurate. Unfortunately, due to the limitations of operating range on this sensor, the only conclusions can be made on the amounts of tVOC in ppb, with a decrease from the surface level starting at about 135 ppb to the 380mb pressure level of 5 ppb.
| genevieve_cooper_poster21-22.pdf |
Page last updated: 2/15/2022
Page designed by: Genevieve Cooper
Page Last Updated by: Genevieve Cooper
Page designed by: Genevieve Cooper
Page Last Updated by: Genevieve Cooper
